Understanding Graphs and Icons for Analyzing and Research: A Comprehensive Guide
Graphs and icons are essential tools in the world of data analysis and research. They help us visualize complex information, making it easier to understand and interpret. This article will explore various types of graphs and icons, their significance, and how they can be used in different fields such as business, education, and technology.
The Importance of Visual Data Representation
In today's data-driven world, the ability to present information visually is more important than ever. Visual data representation helps in:
- Quick comprehension: It allows viewers to grasp information at a glance.
- Effective communication: It simplifies complex data, making it easier to share and discuss.
- Better decision-making: It provides clear insights that can guide strategic choices.
Types of Graphs and Icons
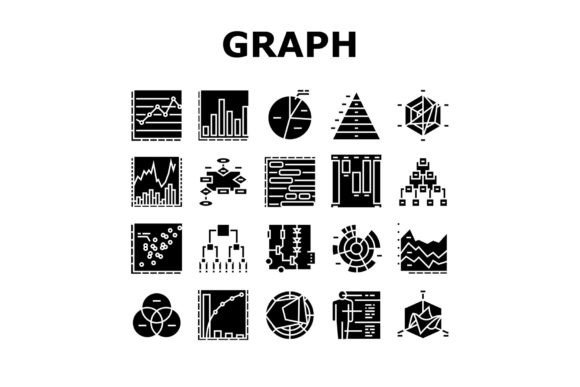
There are several types of graphs and icons used for analyzing and research. Each type has its unique features and applications. Let's explore some of the most common ones:
Hierarchy and Binary Decision Diagrams
A Hierarchy Diagram is used to show the structure of an organization or system. It typically uses a tree-like structure to represent levels of authority or importance. On the other hand, a Binary Decision Diagram (BDD) is a graphical representation of a Boolean function. It is particularly useful in computer science and digital electronics for representing and manipulating logic functions.
Bar Graphs
Bar graphs are one of the most straightforward and widely used types of graphs. They are used to compare quantities across different categories. For example, a bar graph can show the sales figures for different products or the number of students in each grade level.
Radar and Stacked Area Charts
A Radar Chart, also known as a spider chart, is used to display multivariate data in the form of a two-dimensional chart with three or more quantitative variables. It is particularly useful for comparing multiple variables across different groups. A Stacked Area Chart is used to show the relationship of parts to a whole over time. It is ideal for visualizing how different components contribute to a total quantity.
Pareto and Venn Diagrams
A Pareto Chart is a type of bar graph that arranges bars in descending order of frequency, often used to highlight the most significant factors in a dataset. A Venn Diagram is a diagram that shows all possible logical relations between a finite collection of different sets. It is commonly used in set theory, probability, and statistics.
Practical Applications in Modern Life
These graphs and icons are not just theoretical; they have practical applications in various fields:
Business and Finance
In business and finance, bar graphs and Pareto charts are frequently used to analyze sales data, identify key performance indicators, and make informed decisions. Radar charts can help in evaluating the performance of different departments or products across multiple criteria.
Education
In education, hierarchy diagrams are used to organize curricula and learning paths. Bar graphs and stacked area charts are useful for tracking student performance and progress over time. Venn diagrams are often used in teaching set theory and logical reasoning.
Technology and Engineering
In technology and engineering, binary decision diagrams are used in circuit design and software development. Radar charts can be used to compare the performance of different technologies or systems. Stacked area charts are useful for visualizing the breakdown of resource usage over time.
Common Misunderstandings and Clarifications
While these graphs and icons are powerful tools, there are some common misunderstandings about their use:
- Misinterpretation of data: It's crucial to understand the context and scale of the data being represented. Misinterpretation can lead to incorrect conclusions.
- Overcomplication: Using too many types of graphs or overly complex designs can confuse rather than clarify. Simplicity is often key to effective communication.
Formats and Accessibility
The graphs and icons discussed in this article are available in various formats, including JPG and EPS. These formats ensure that the visuals are accessible and can be easily integrated into different documents and presentations.
JPG format is ideal for web and digital use, providing a good balance between quality and file size. EPS format, on the other hand, is vector-based and is perfect for high-quality printing and scalability without losing resolution.
Conclusion
Graphs and icons are indispensable tools for analyzing and researching data. By understanding the different types and their applications, you can effectively communicate complex information and make better-informed decisions. Whether you are in business, education, or technology, these visual aids can significantly enhance your ability to understand and present data.
For more detailed information and resources on creating and using these graphs and icons, you can visit our resource page.